Demonstration · Illustrative data · BI Consulting Services
R&S
Rudolph and Sletten×BI Consulting Services
Prepared for Alan Business Analyst · September 2026
Portfolio job-cost board: WIP, cost-to-complete and schedule across five California offices
You described a general contractor building out internal analytics capabilities and wanting clean, maintainable solutions our team can own long-term. This is what milestone one could look like: every active job in one semantic model, with cost-to-complete, over/under billings, schedule variance and safety on a single page — and the model behind it documented so your team runs it, not a consultant. Switch office and market to see the same page re-cut.
Cost curve: planned vs actual spend, and what was billed
Bars are actual job cost booked each month; the dark line is the planned cost curve from the schedule of values; the red line is progress billing. Gaps between the two lines are your over/under billings.
Actual costPlanned costBilled
What this board answers
Three questions a business analyst gets asked before the monthly ops review, each answered with a number that recalculates when you change the filters.
Where the work is: active jobs by office, sized by contract value
Each circle is one active job placed at the office that runs it. Size is contract value; colour is projected cost at completion against budget (green under, amber within ±2%, red over). Hover any job.
Built to be owned: the model behind this page
One fact table, five dimensions, documented measures. This is the part your team keeps after milestone one — the same model feeds every visual here.
Markets ranked by contract value in flight
Bar is share of active contract value. Right columns: projected margin at completion, jobs behind schedule by 10+ days, and net over/(under) billings.
Safety: hours and recordables in the window
Total recordable incident rate = recordables × 200,000 ÷ hours worked, by office, against a 1.0 internal target.
Job cost detail: the ten largest active jobs in view
The row-level view a project executive drills to from any tile above. Cost variance is estimate-at-completion against the current budget; schedule variance is working days against the baseline.
Also from BI Consulting Services
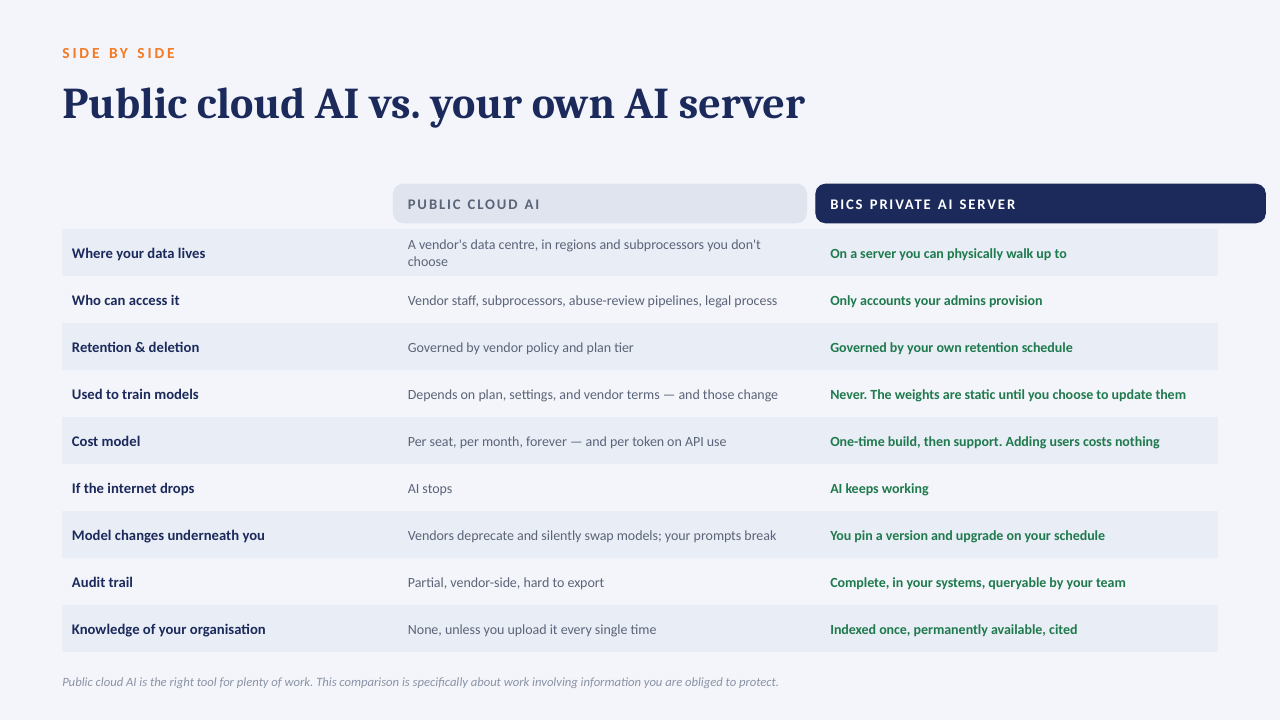
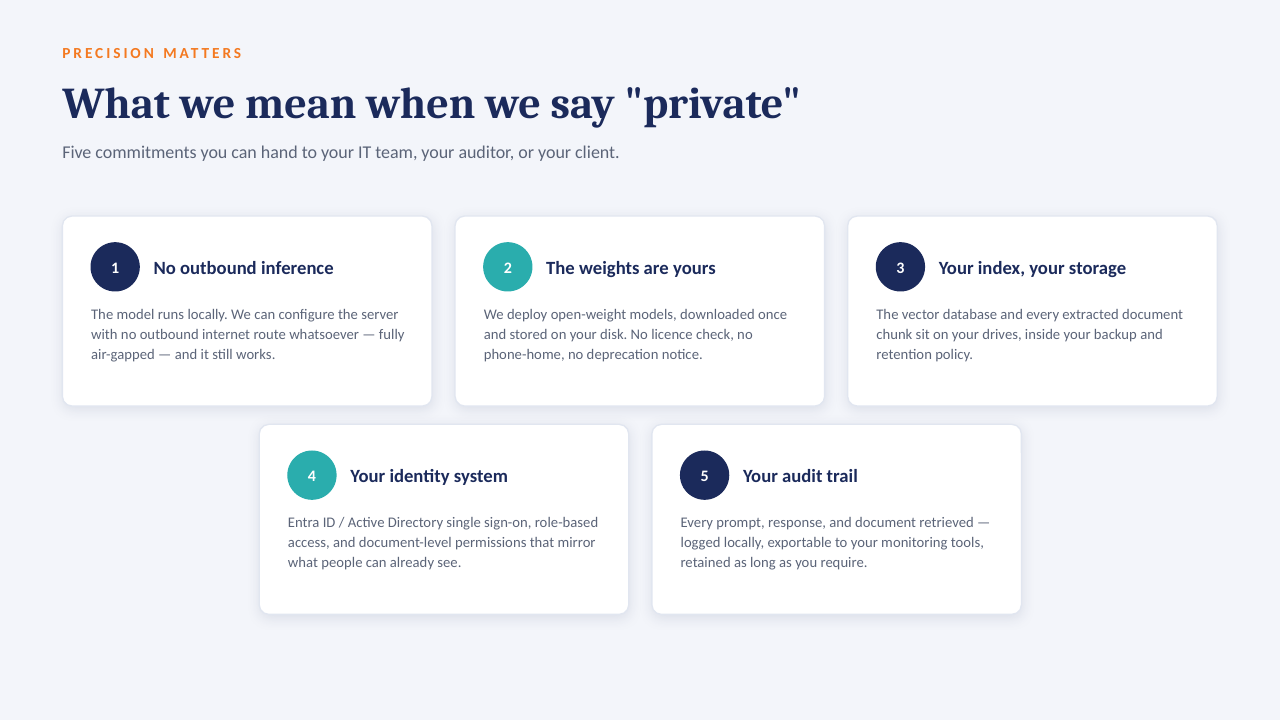
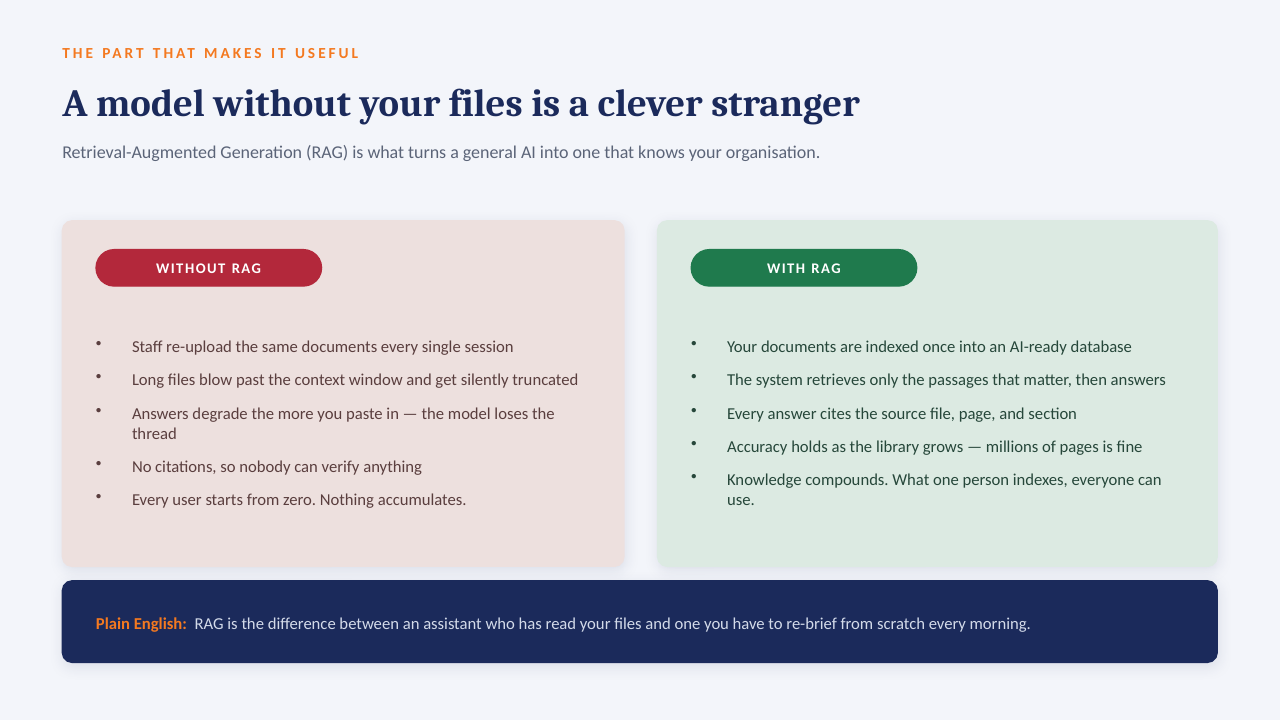
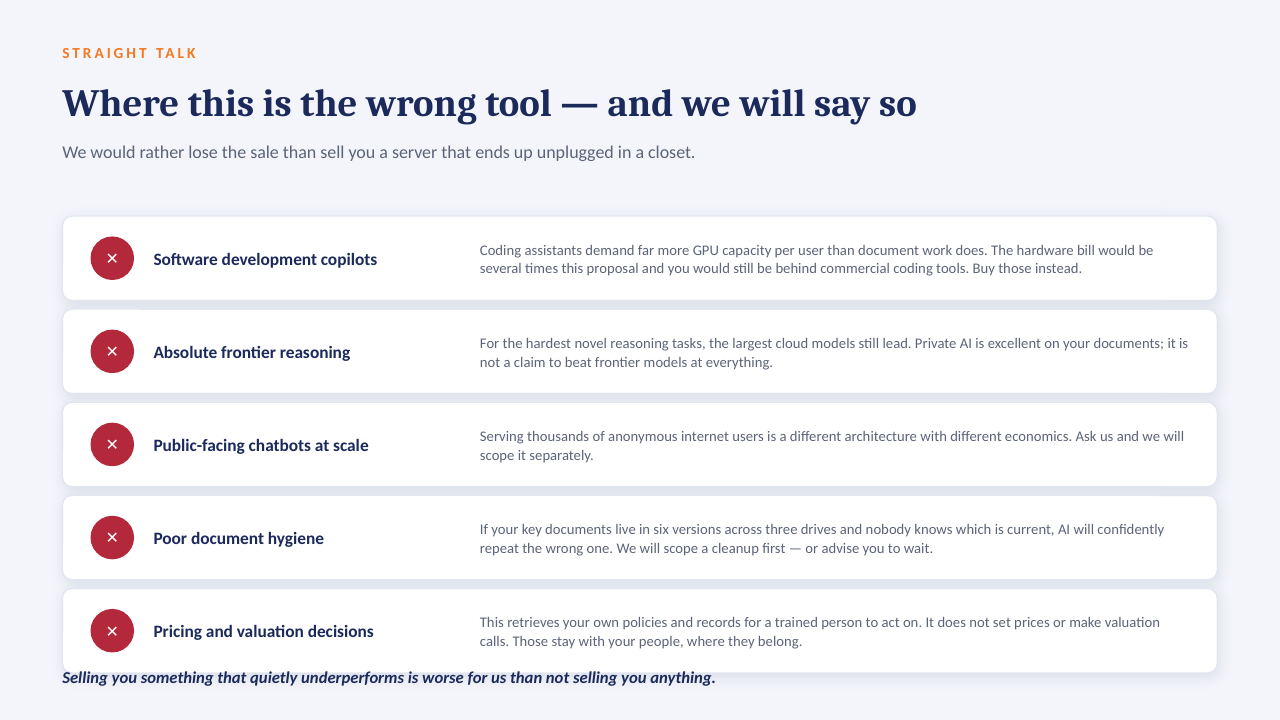
Private AI on your own server
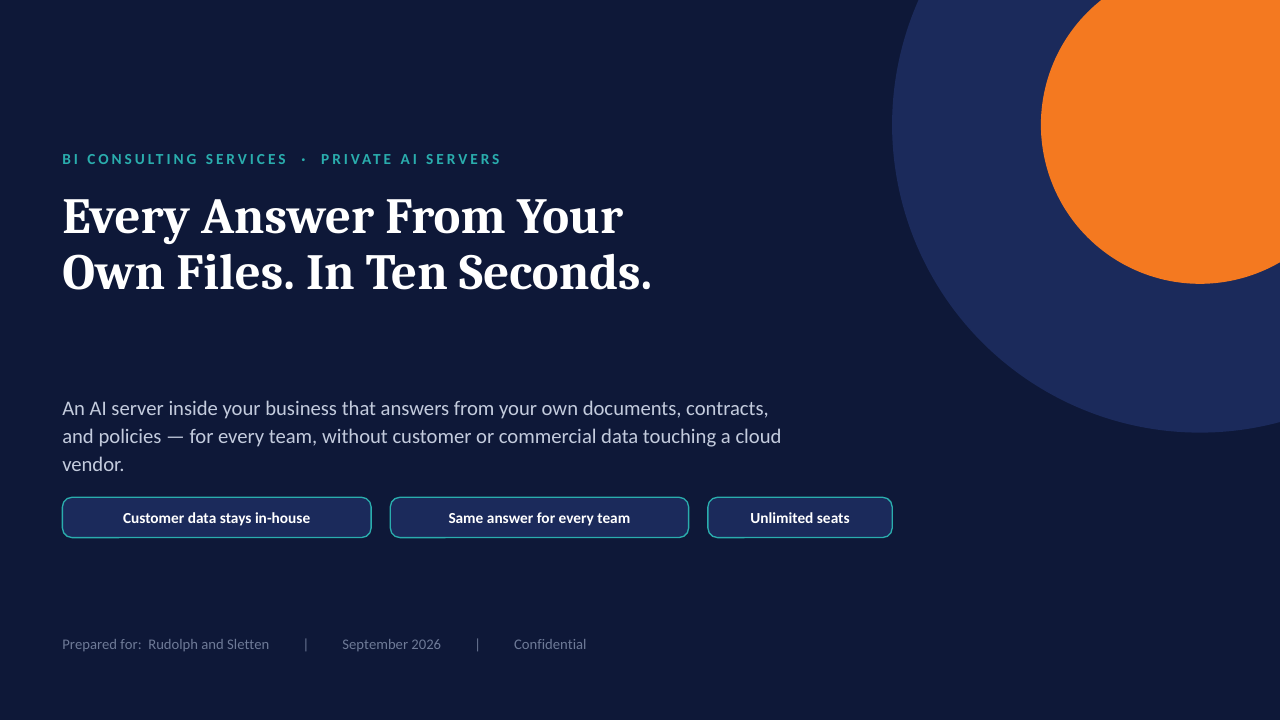
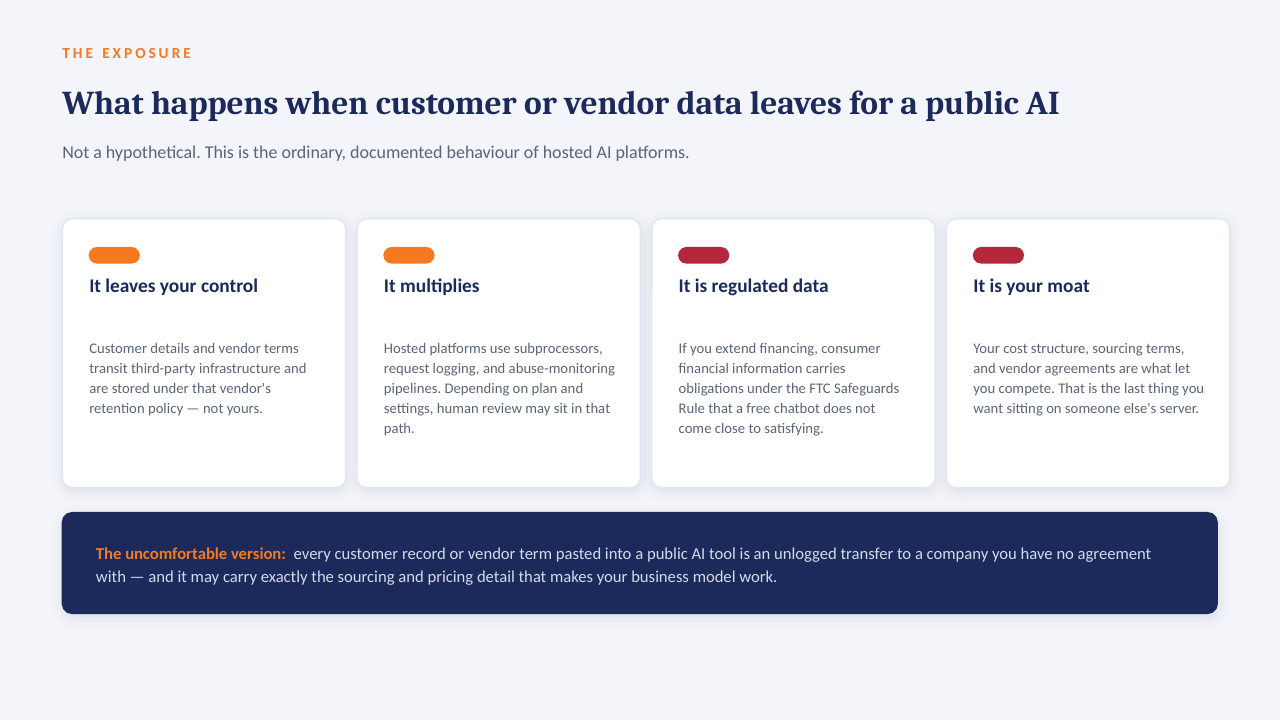
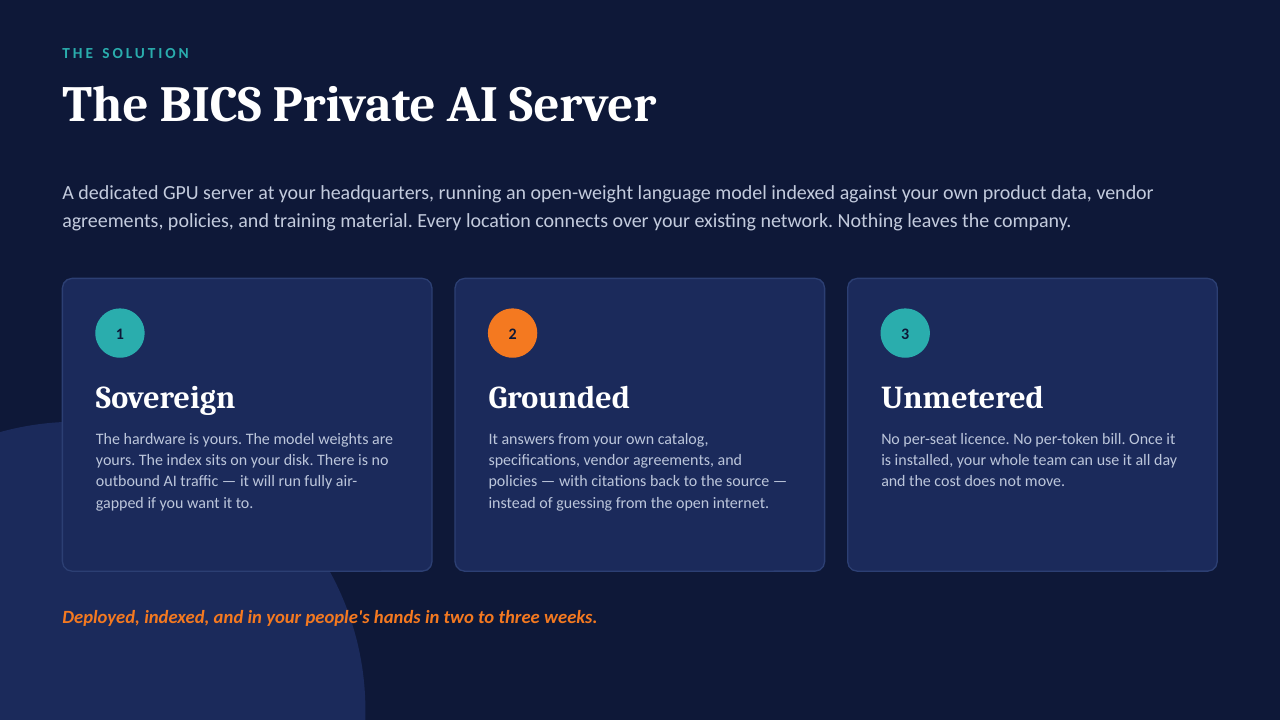
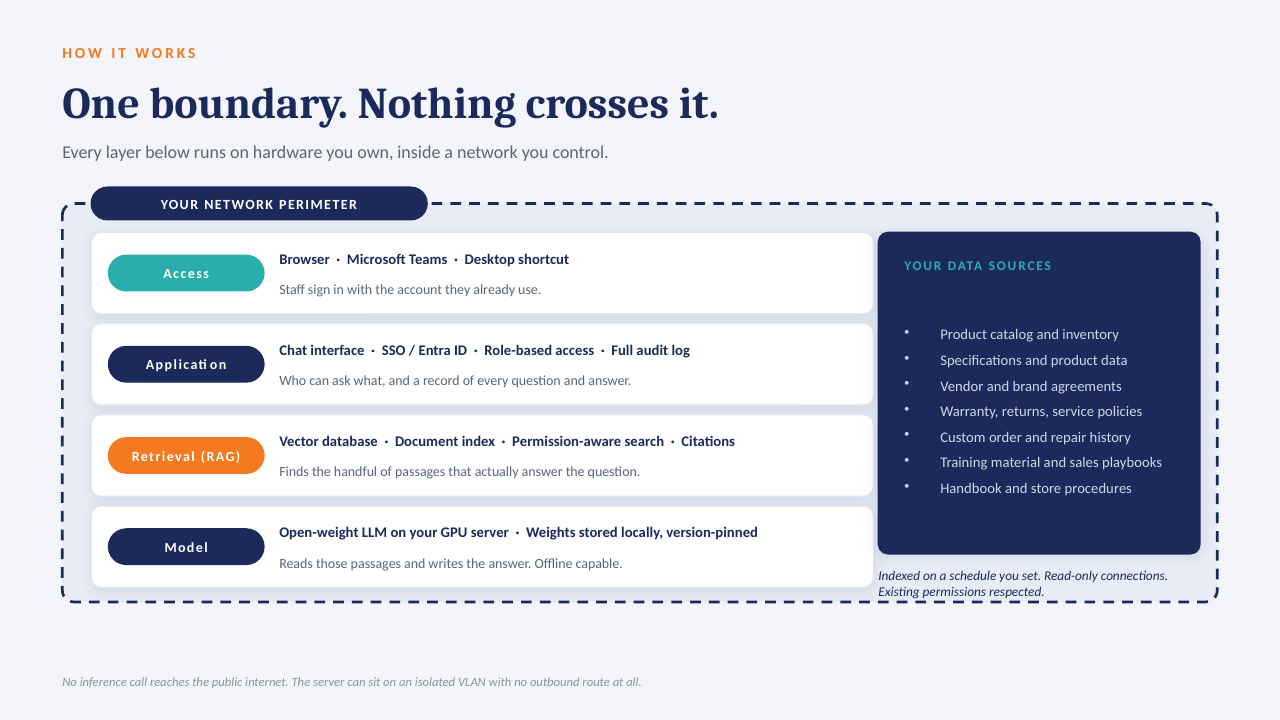
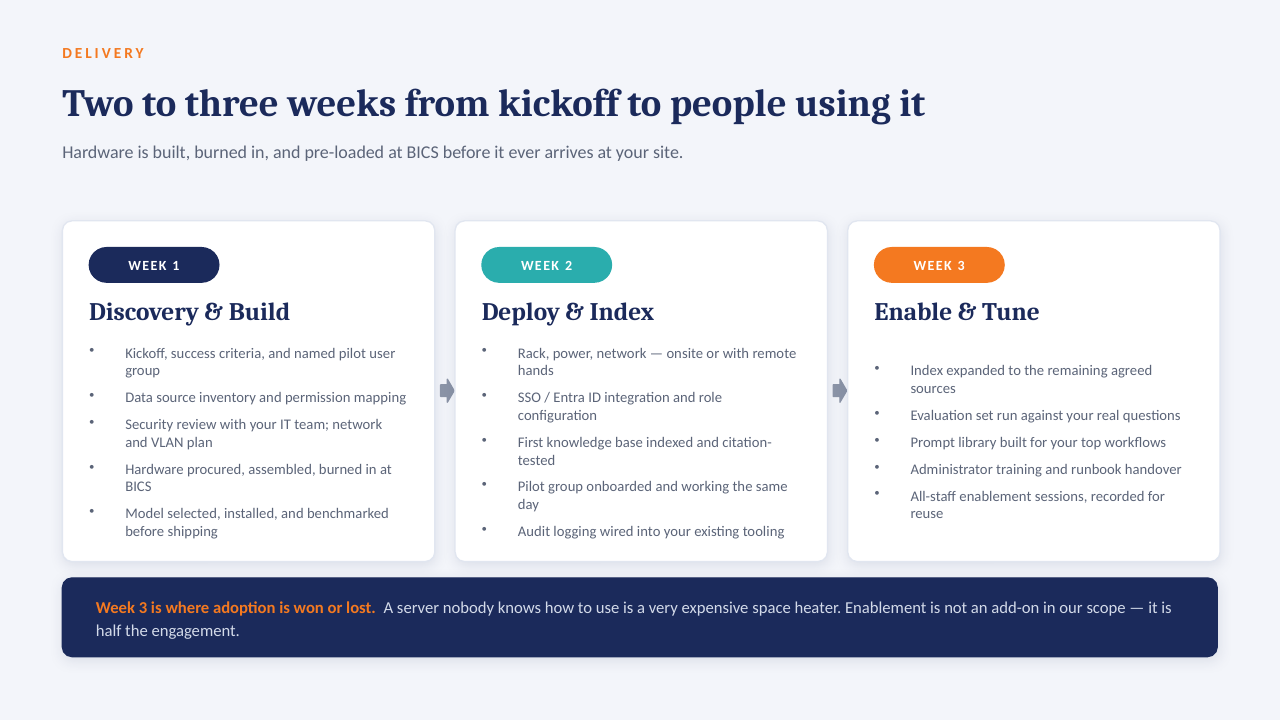
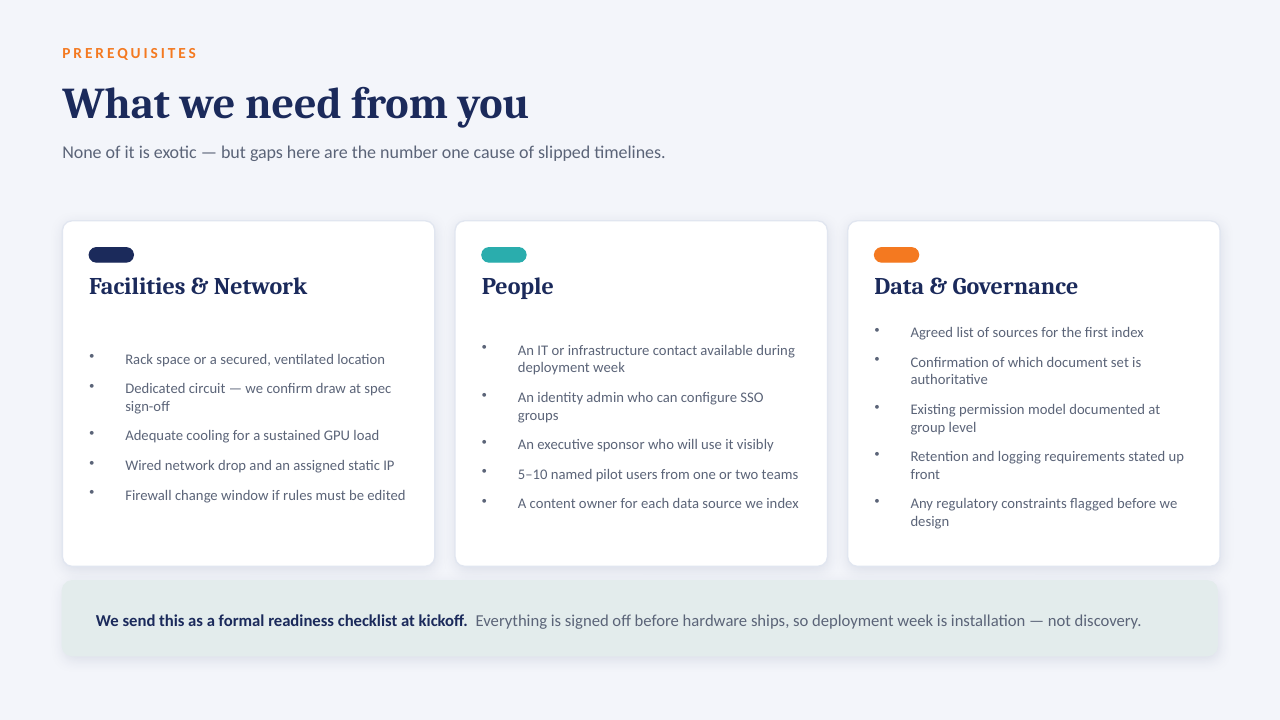
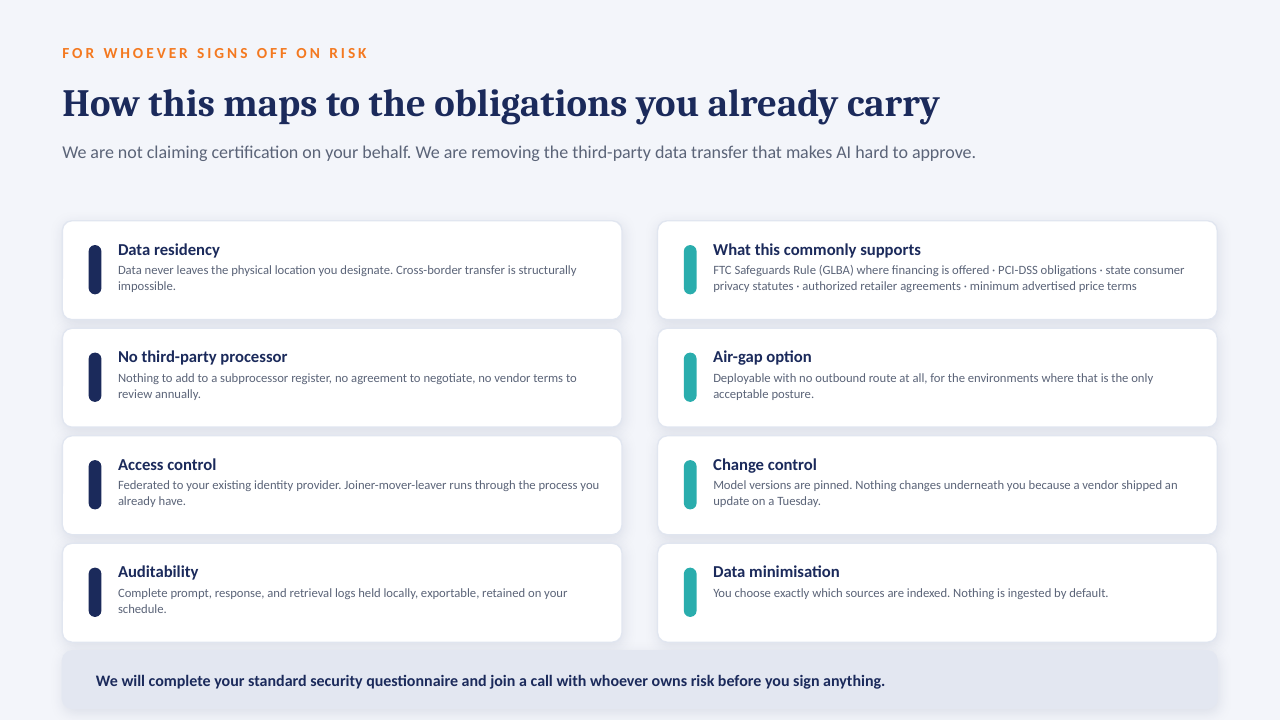
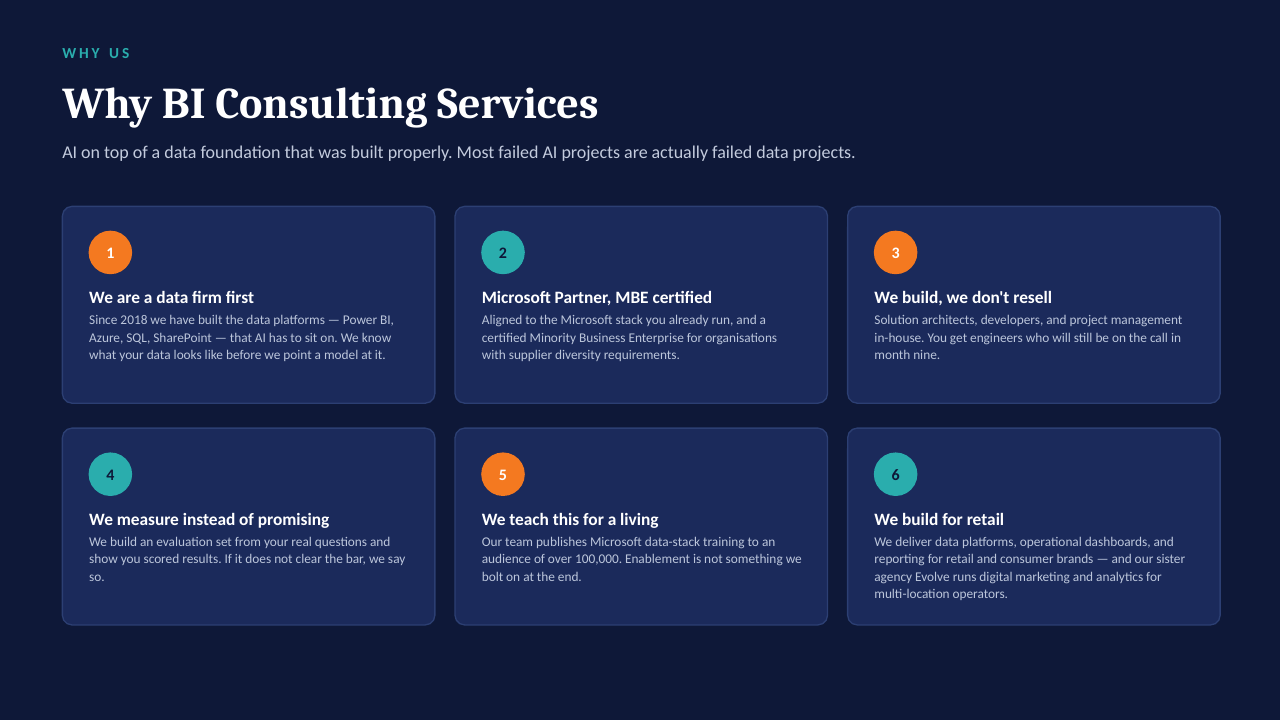
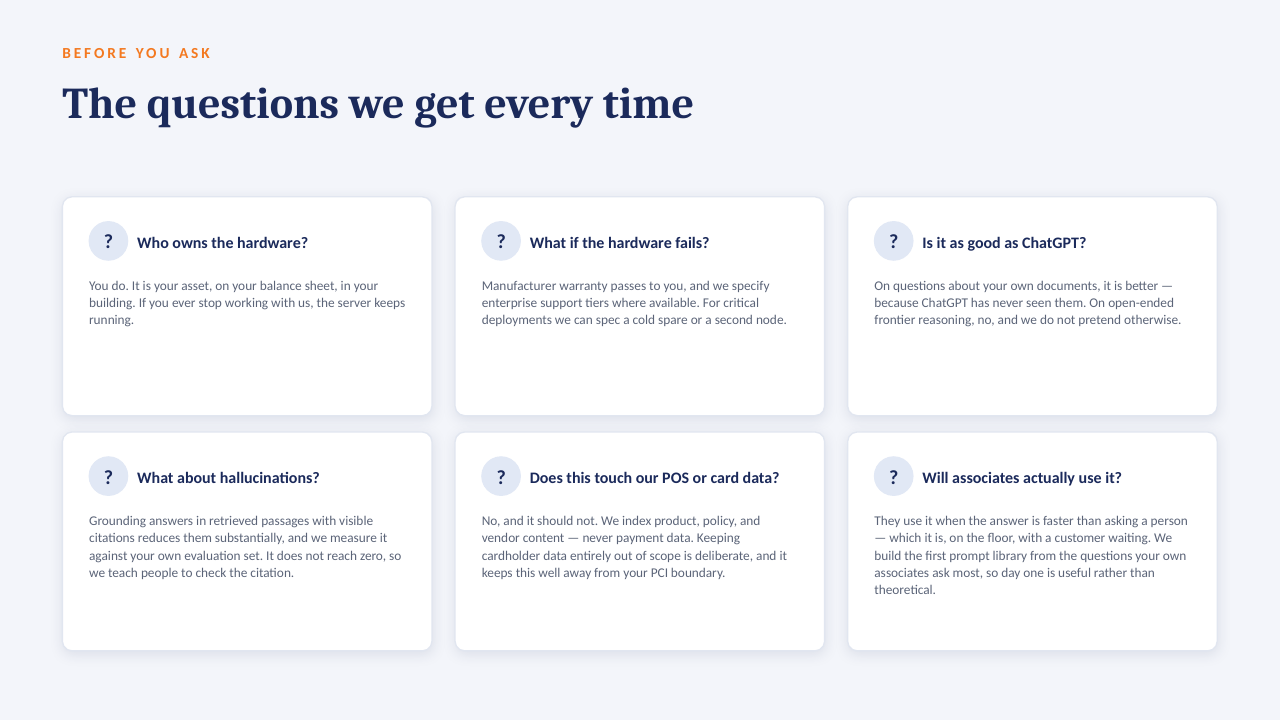
The "ask the data" ideas on this board are designed to run on a GPU server inside your own network — an open-weight model over your own documents, cited answers, no per-seat licence, nothing leaving the building. The short deck below explains how it works. Scroll through, or download it as a PDF.